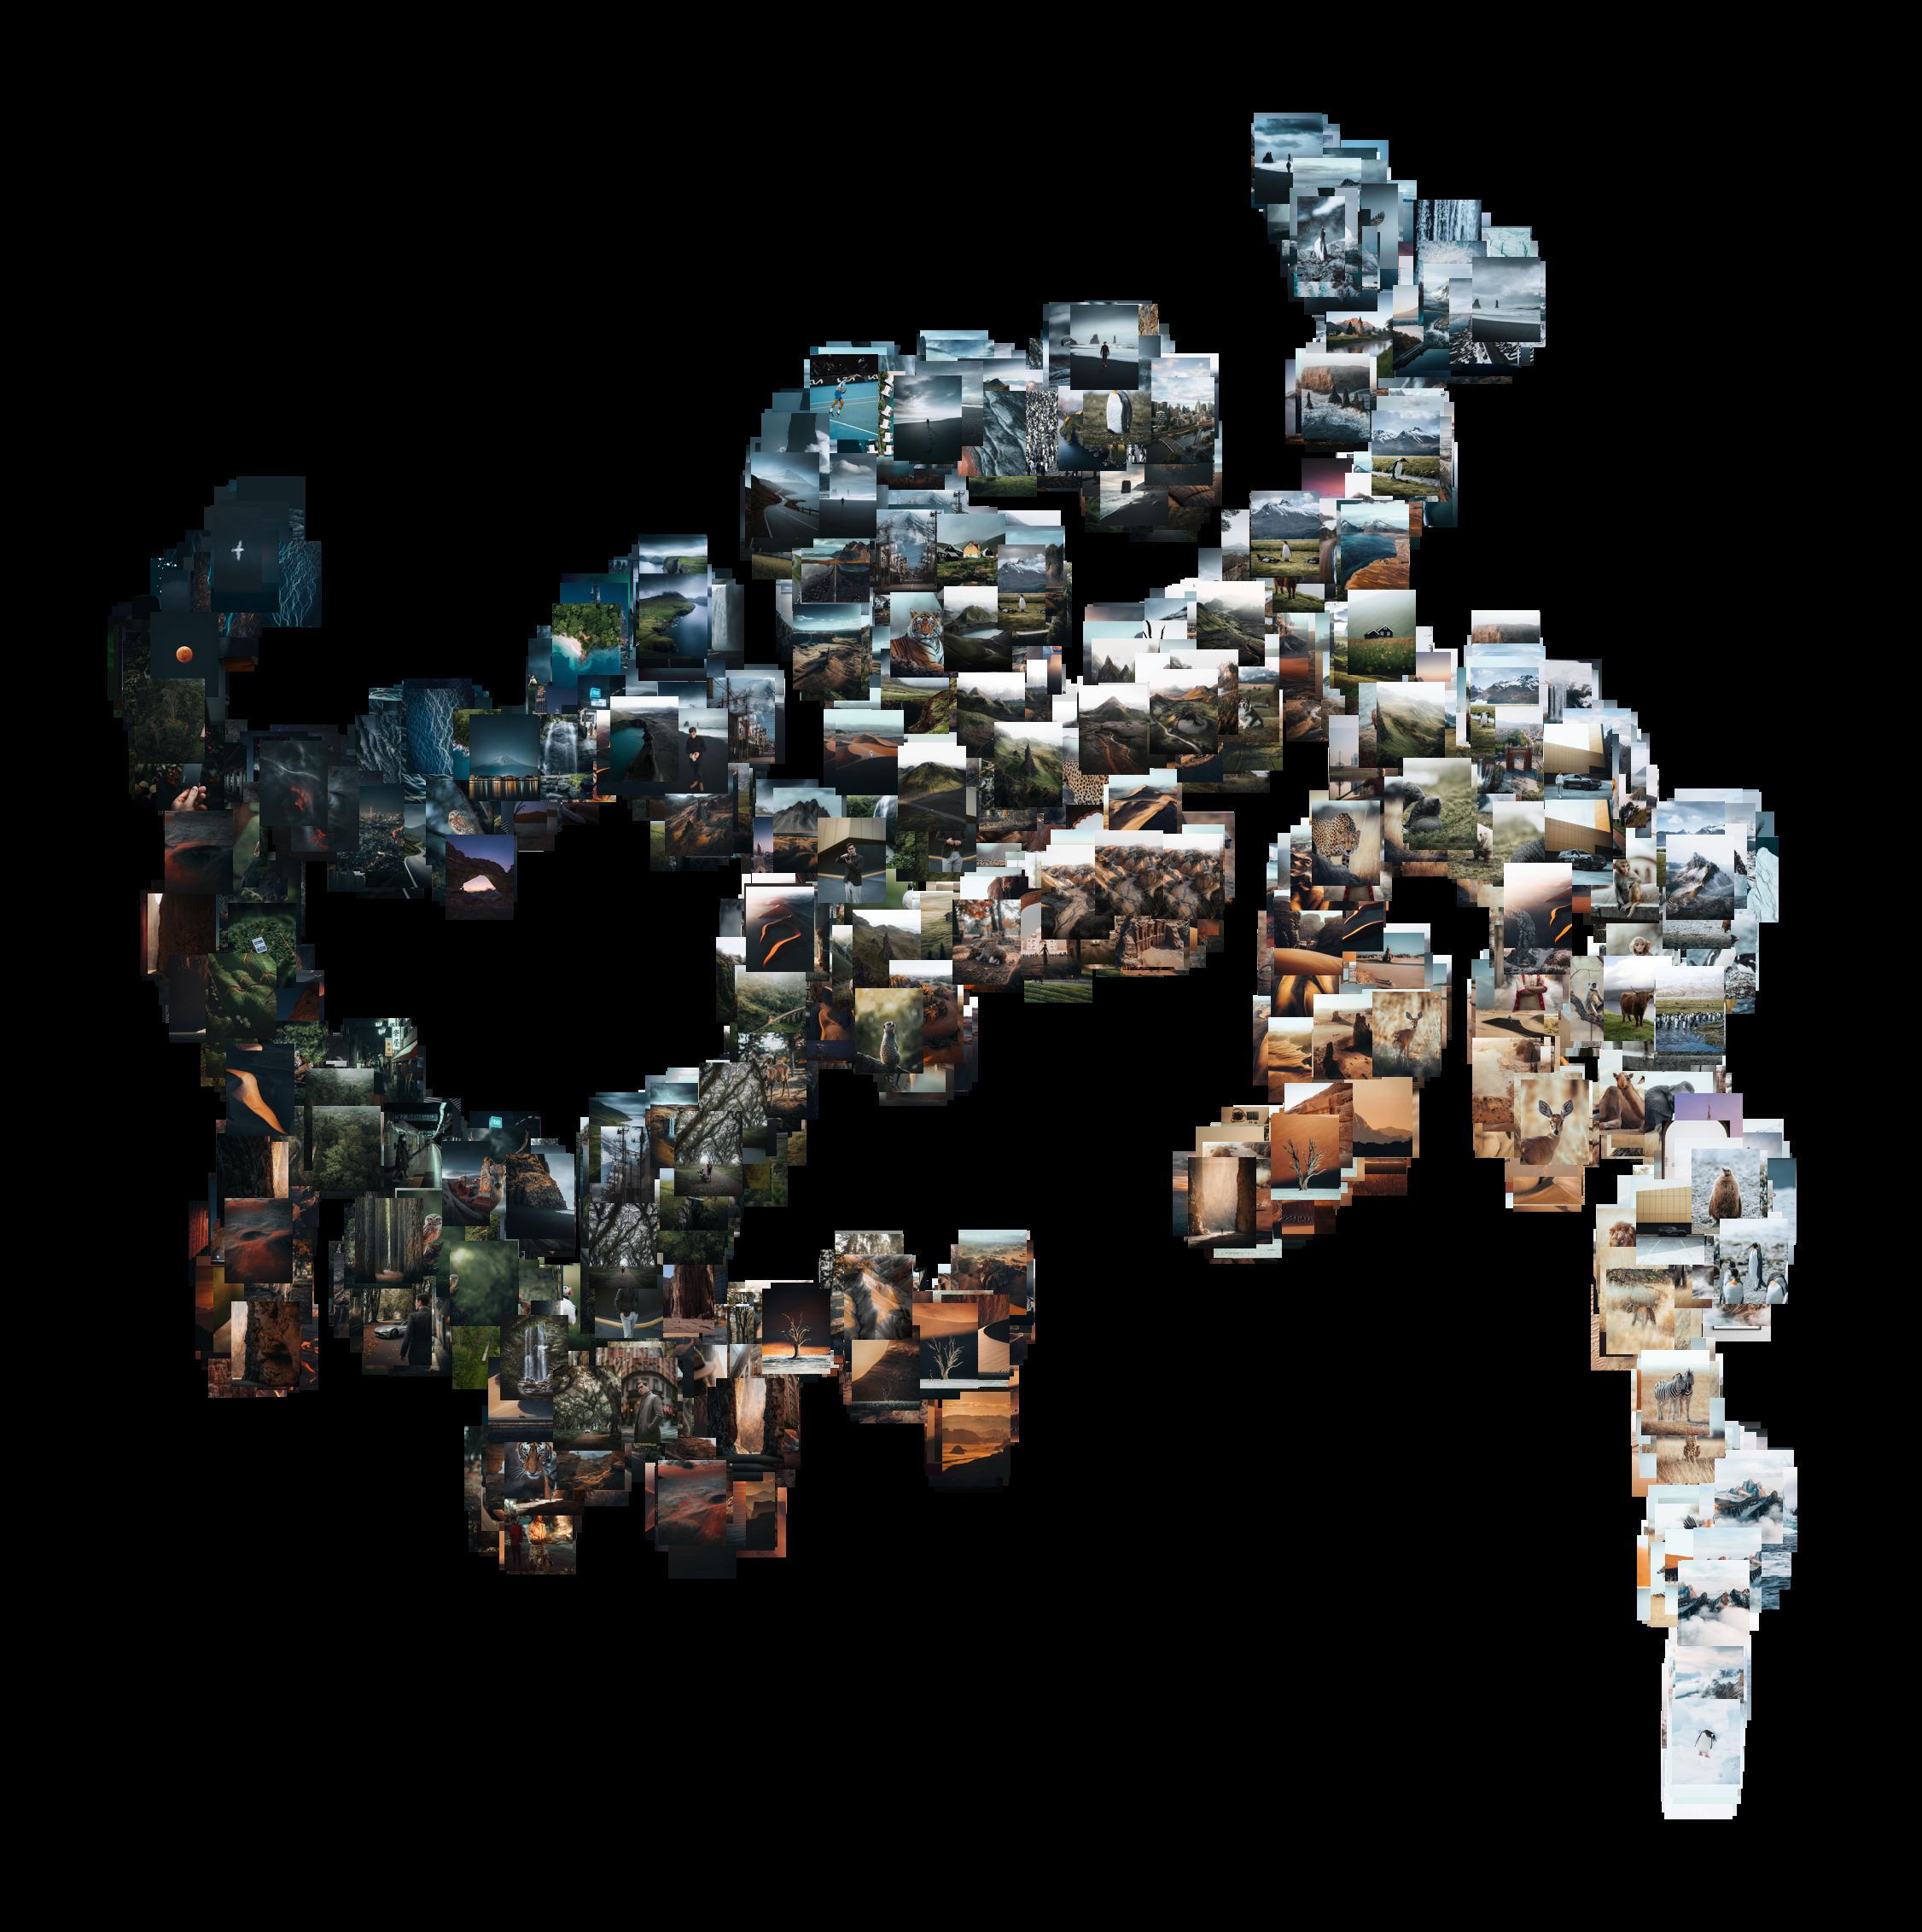
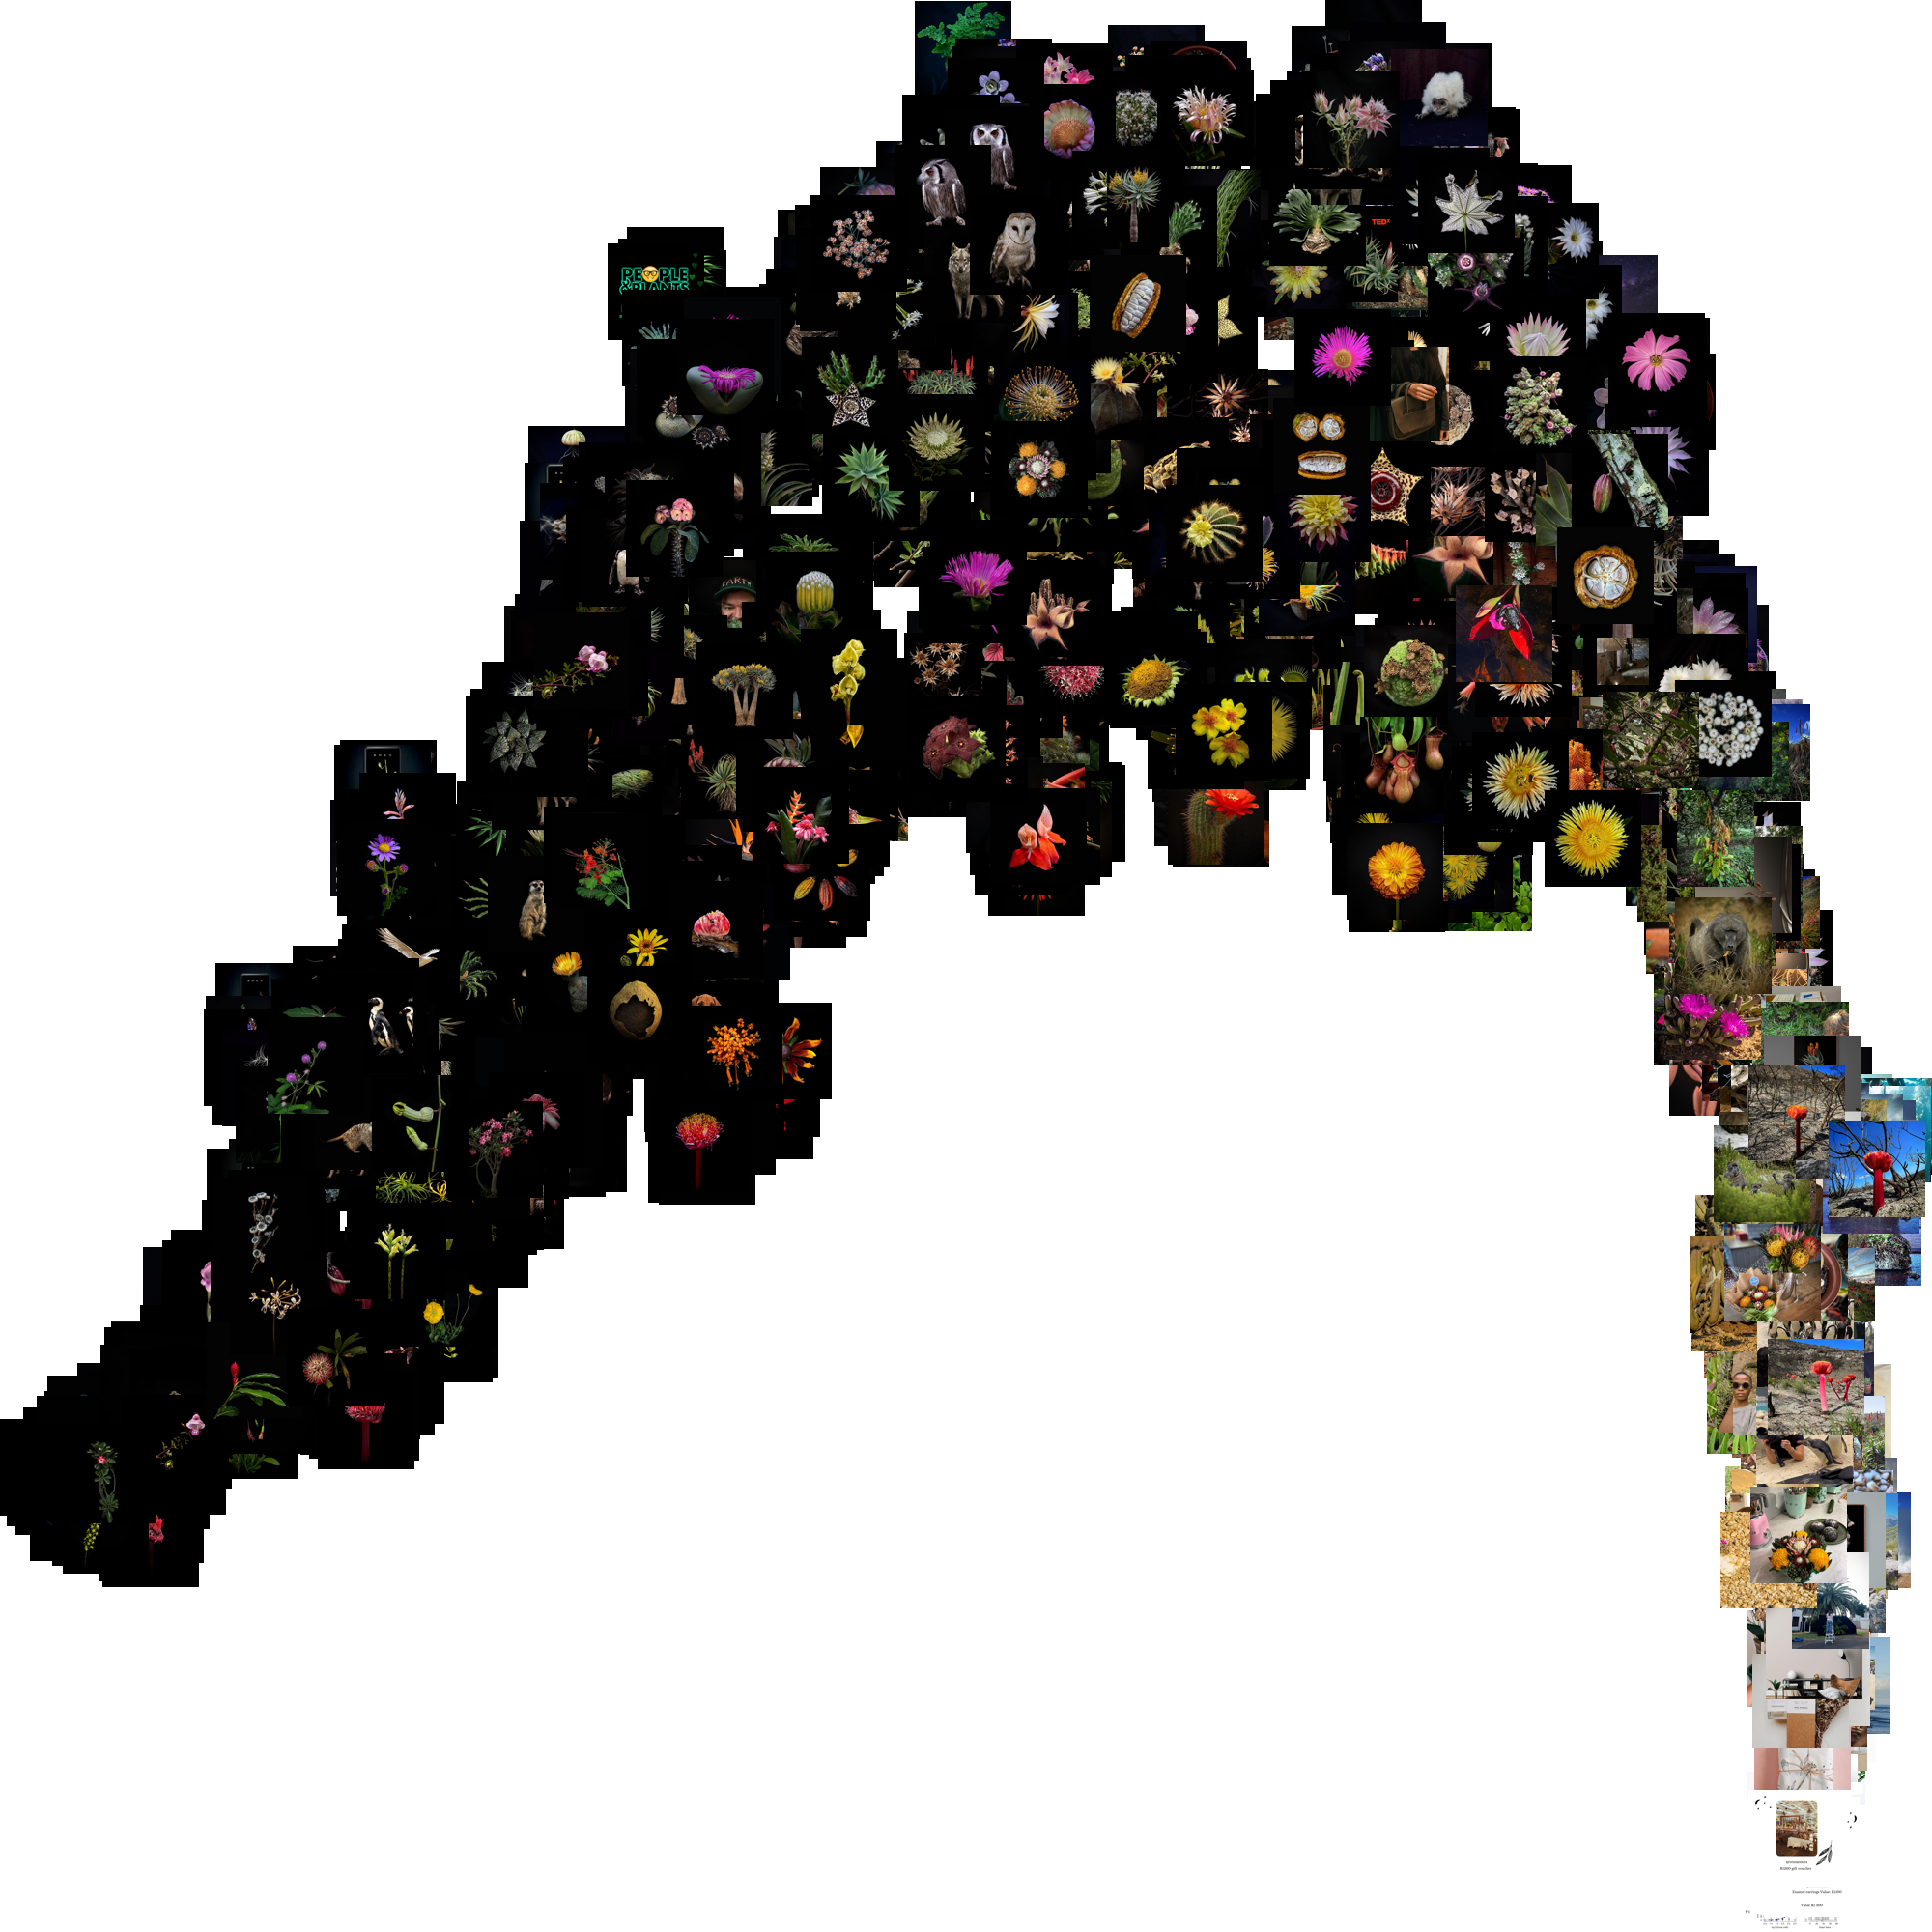
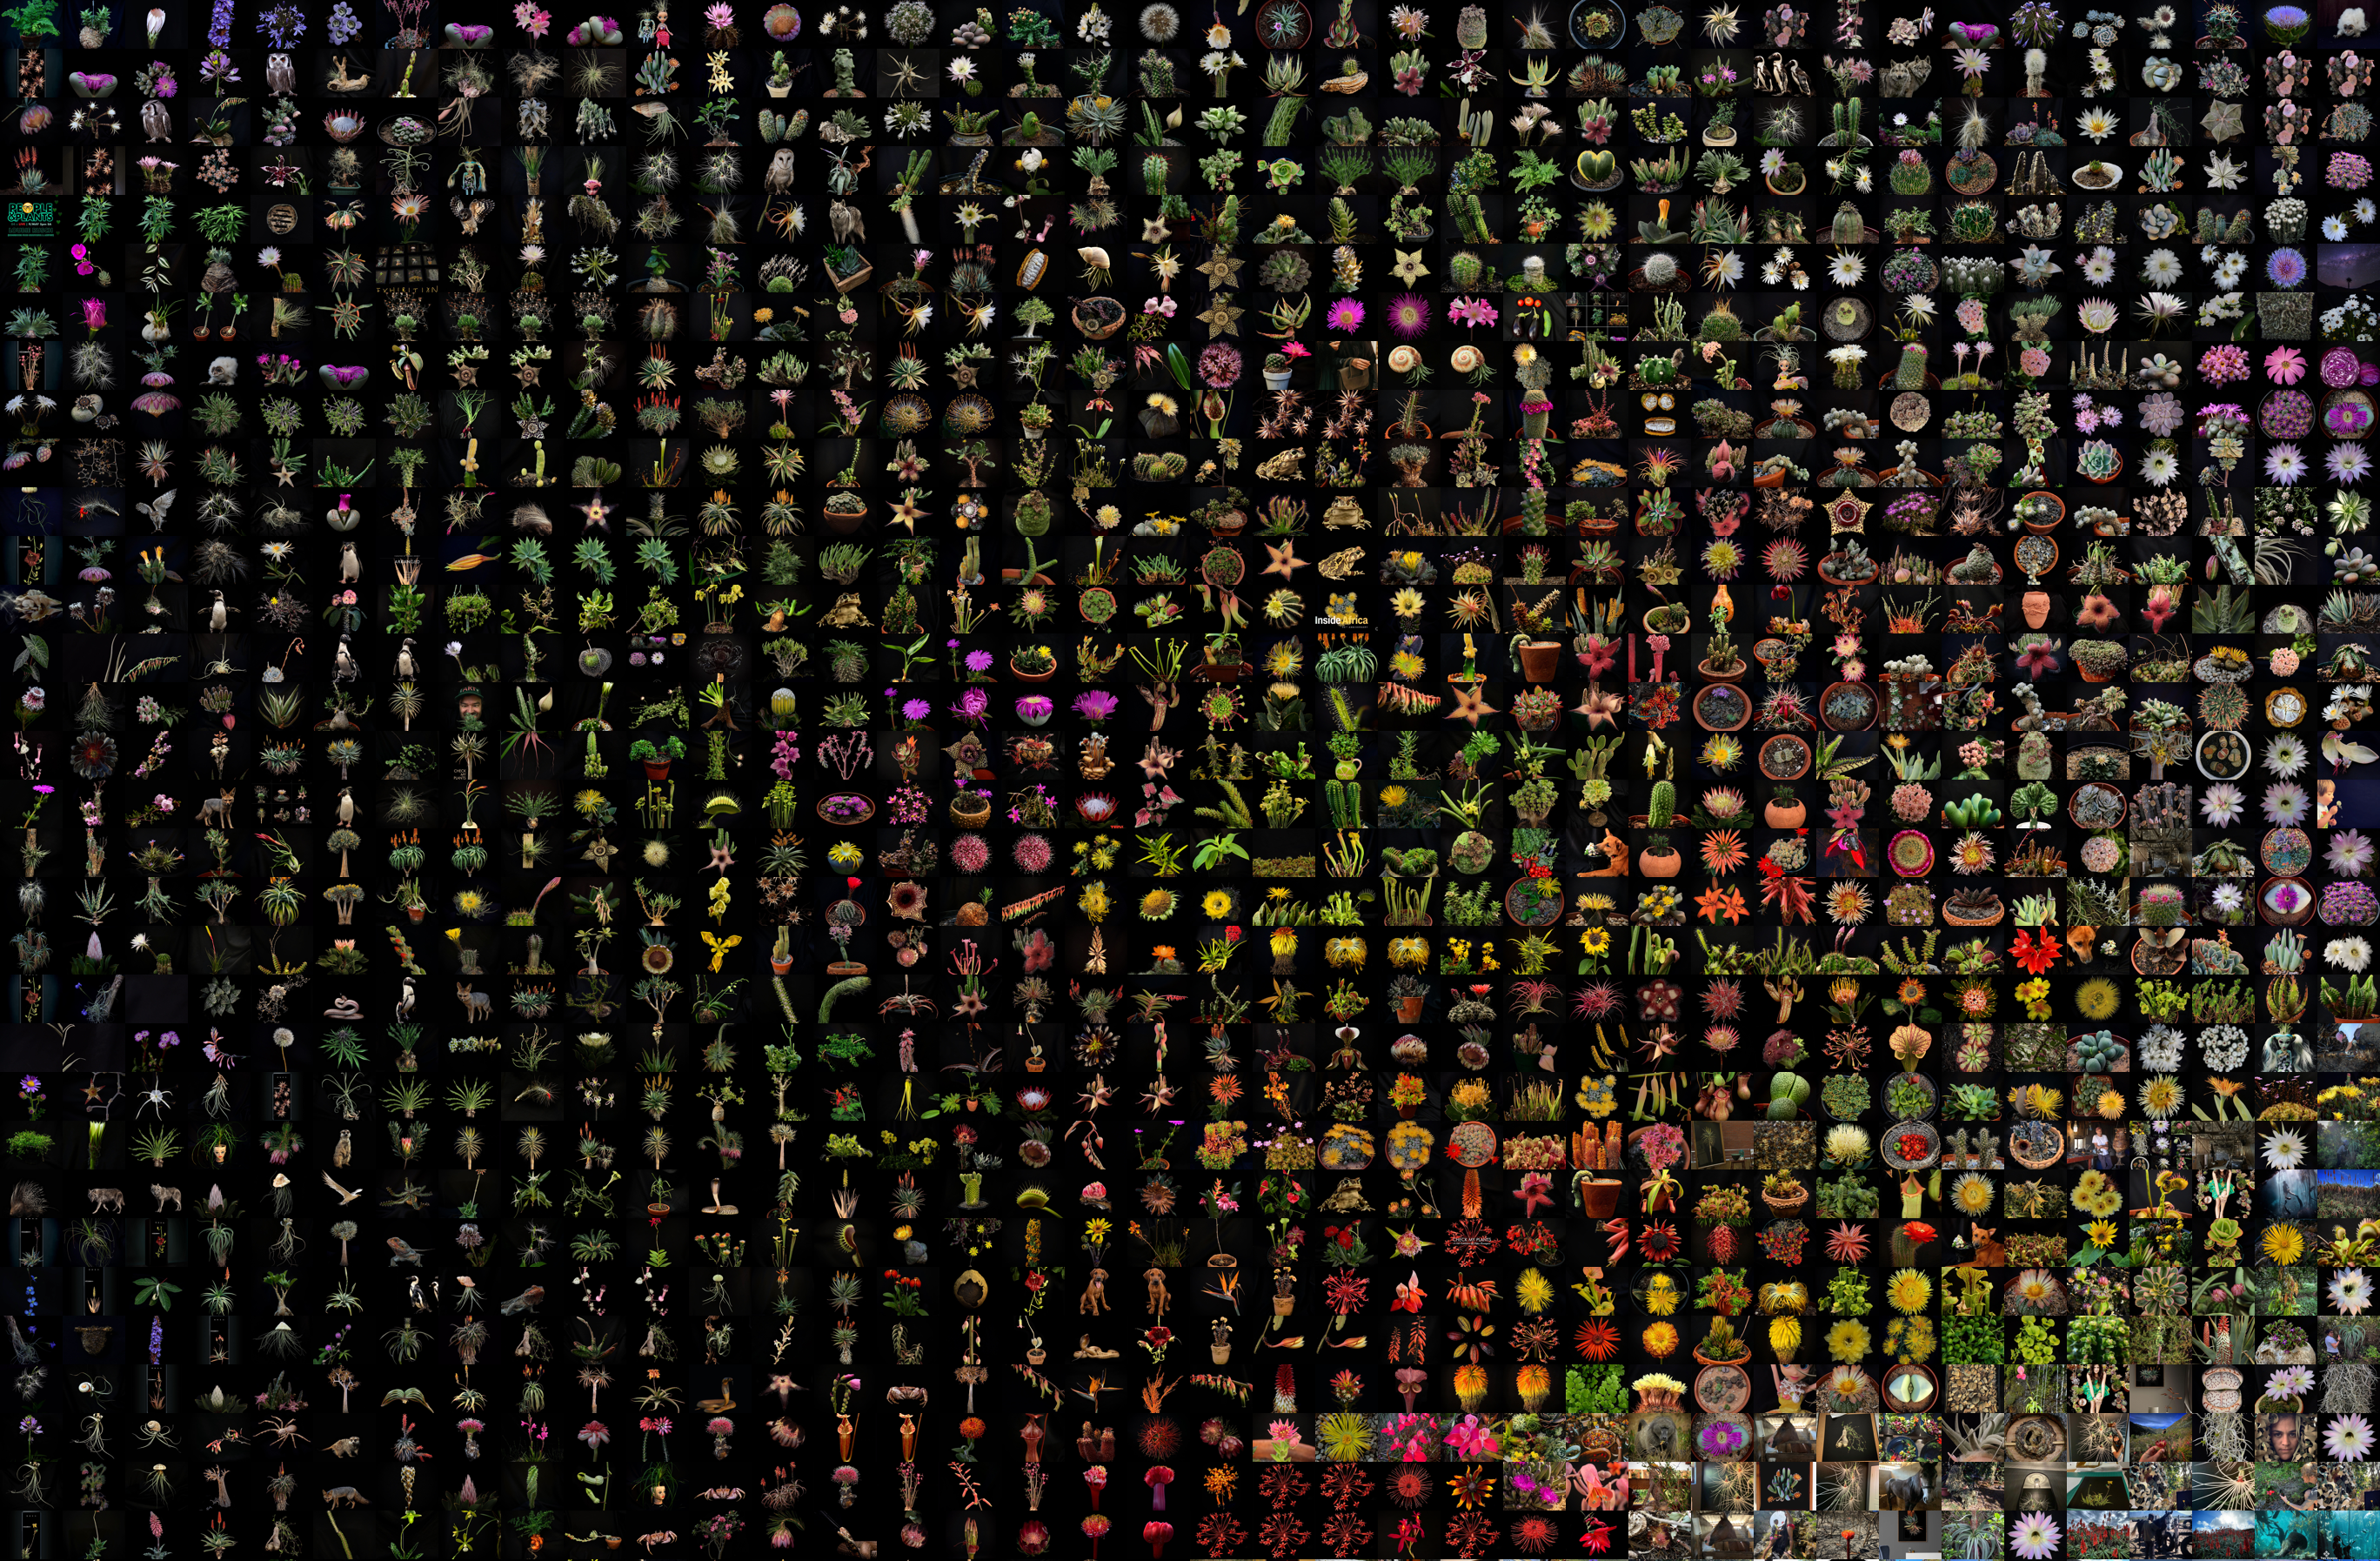
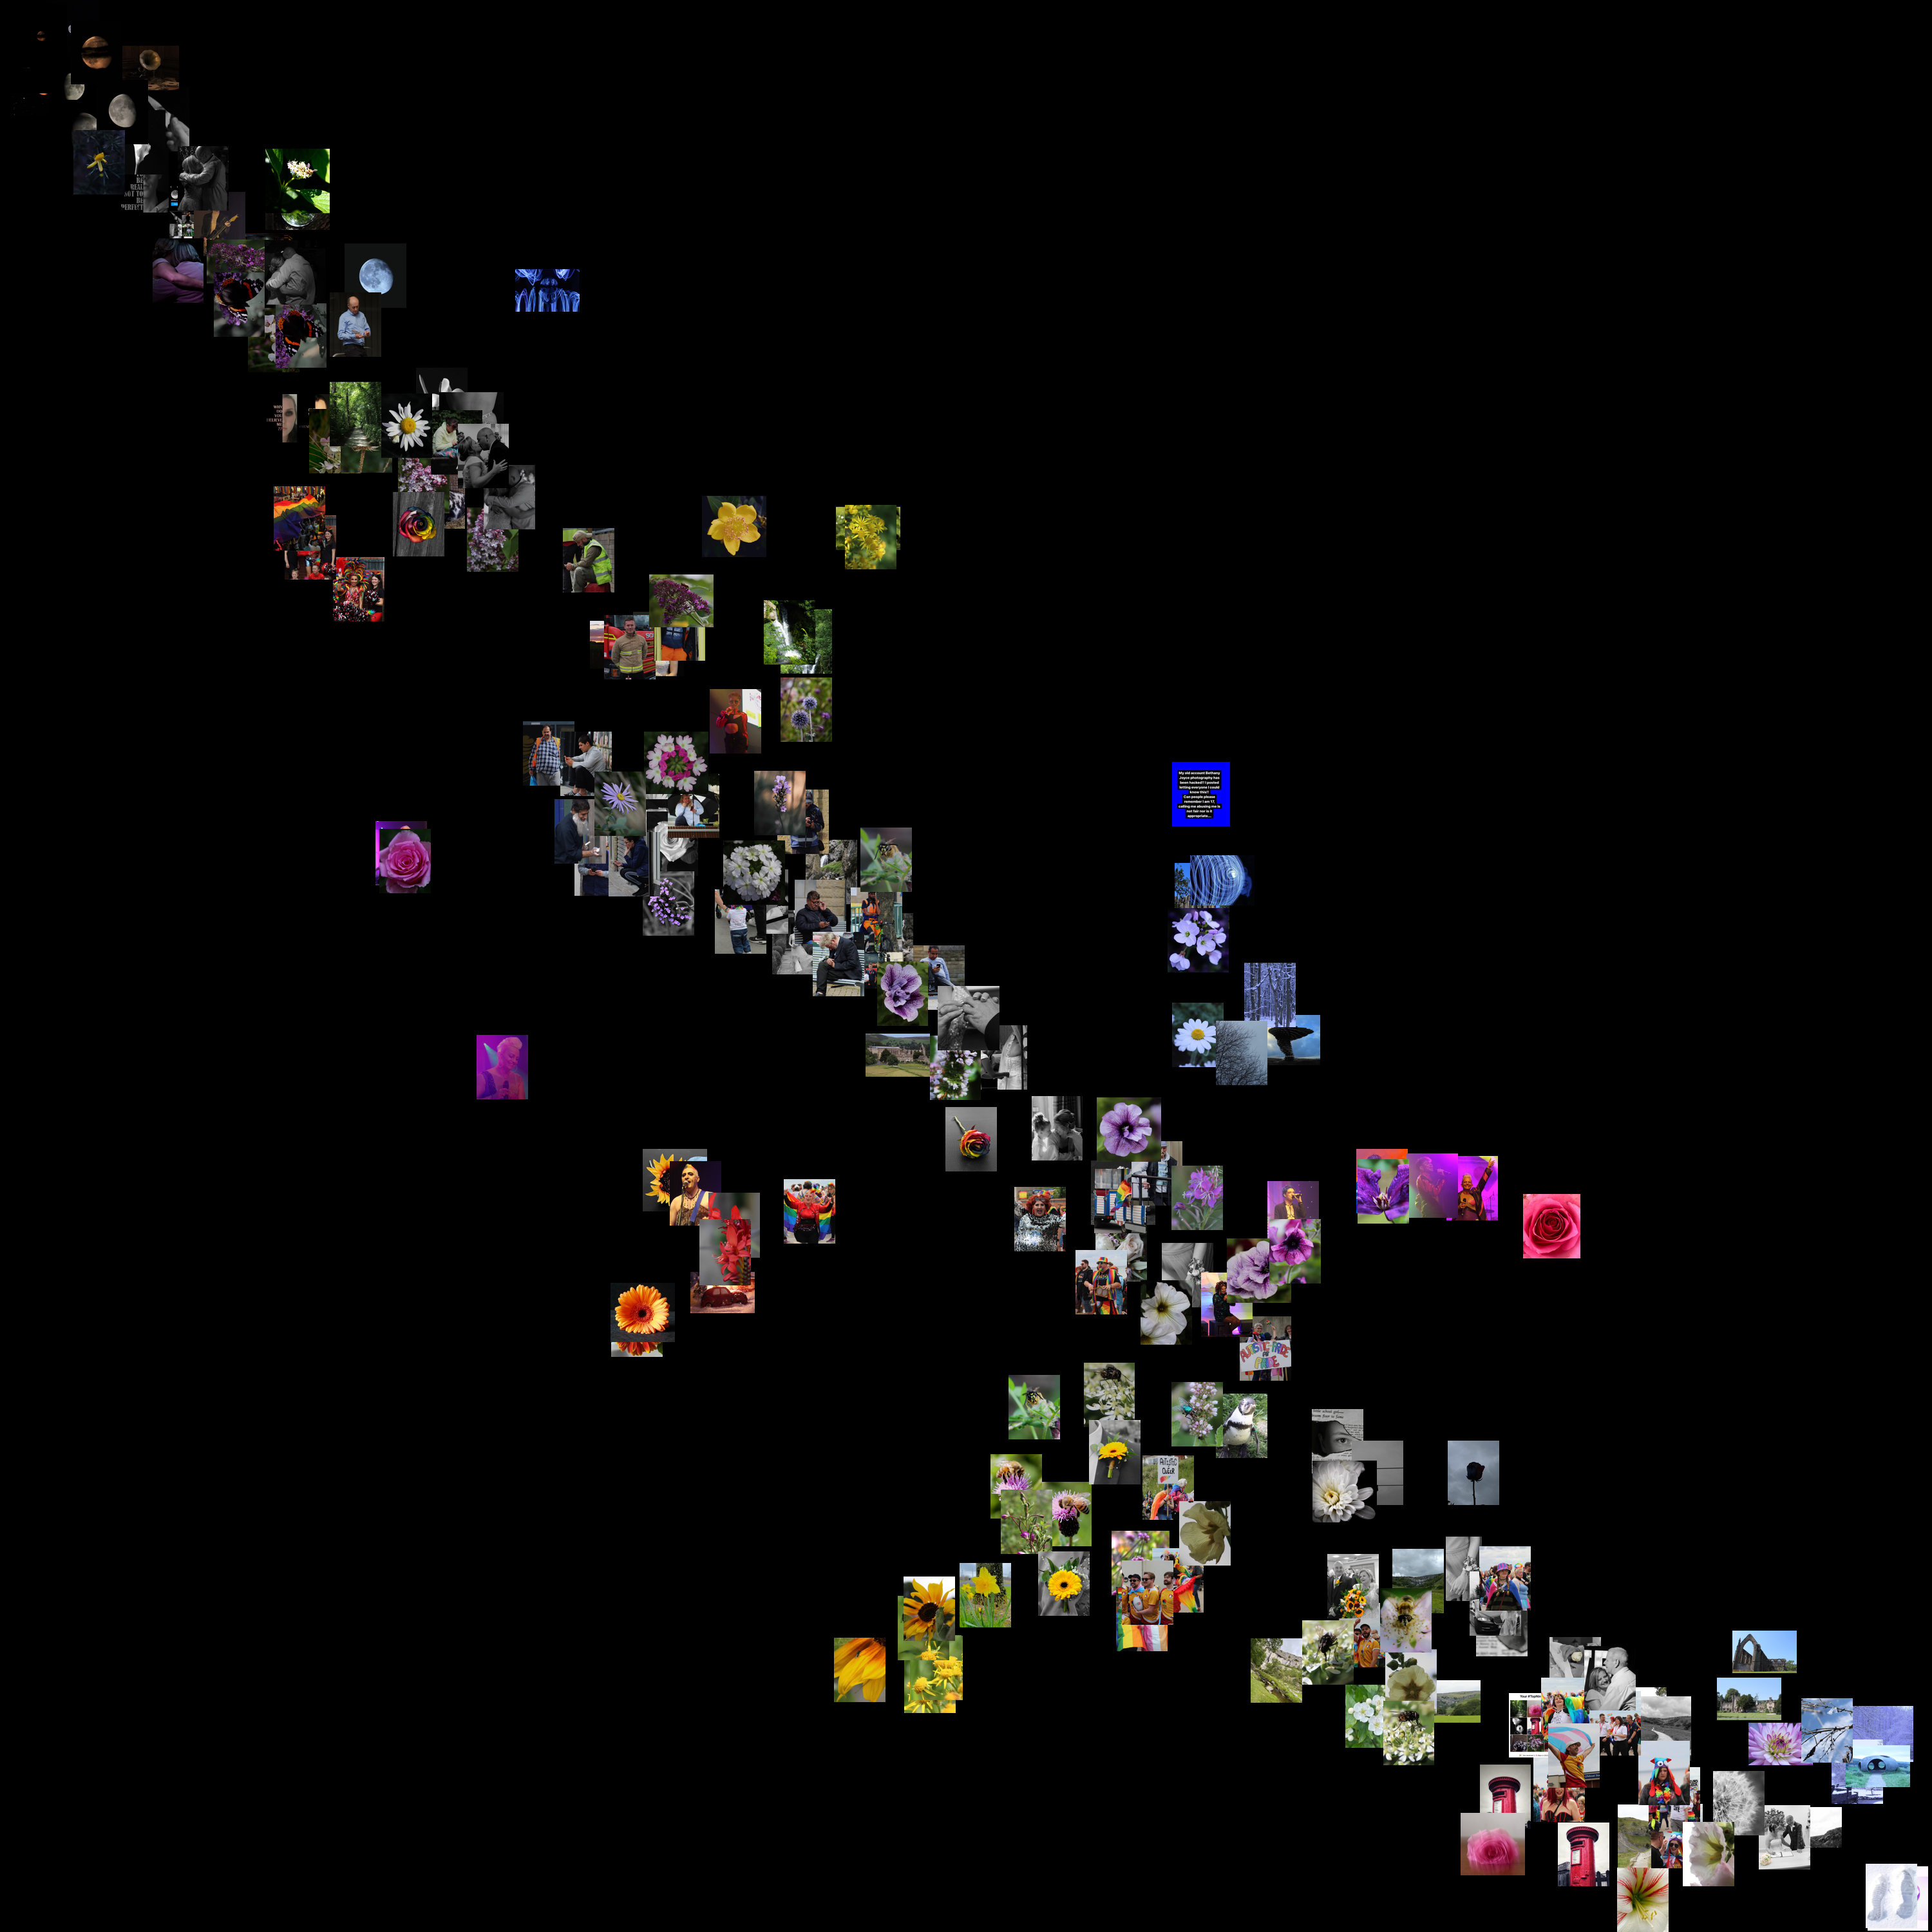
t-SNE is a powerful technique for visualizing high-dimensional data in a low-dimensional space. It is particularly useful for exploring the structure of complex datasets and identifying patterns or clusters.
This repository contains a Python package for visualizing high-dimensional data using t-distributed Stochastic Neighbor Embedding (t-SNE) algorithm.
Features
- Apply t-SNE to your high-dimensional data (especially image datasets).
- Visualize the results in 2D.
- Customize the visualization with various parameters
- Save the visualizations as image files.
Gallery
References
[1] L.J.P. van der Maaten and G.E. Hinton, "Visualizing High-Dimensional Data Using t-SNE," Journal of Machine Learning Research, vol. 9, pp. 2579-2605, 2008. [Online]. Available: https://www.jmlr.org/papers/volume9/vandermaaten08a/vandermaaten08a.pdf
[2] G.E. Hinton and R.R. Salakhutdinov, "Reducing the Dimensionality of Data with Neural Networks," Science, vol. 313, no. 5786, pp. 504-507, 2006. [Online]. Available: https://www.cs.toronto.edu/~hinton/absps/tsne.pdf


